When you line up at a HYROX start, you're not just racing against the clock—you're competing within your age group against athletes with similar physiological advantages and limitations. But how much does age actually matter? Are you faster or slower than average for your age bracket? And where do the performance gaps emerge between younger and older athletes?
We analyzed 5000+ race results from three major European HYROX events (Utrecht, Madrid, and Bordeaux 2025) to answer these questions with hard data. The findings challenge some assumptions about aging and performance while confirming others in striking detail.
The bottom line: Age matters, but not how you think. The performance decline isn't catastrophic, the variability within age groups is massive, and your biggest competition isn't the 25-year-old next to you—it's the version of yourself that didn't train properly.
The Data Set: Who We Analyzed
Our analysis covers:
- 4,309 male athletes across 11 age groups (16-24 through 75-79)
- 943 female athletes across 9 age groups (16-24 through 60-64)
- Three European HYROX events in late 2025
- Only athletes with complete finish times and valid age group data
All finish times were filtered to remove obvious data errors (times under 53 minutes or over 3 hours), leaving us with clean, reliable performance data spanning nearly 60 years of age range.
The Big Picture: How Age Affects Performance
Let's start with the headline numbers. Here are the average finish times by age group:
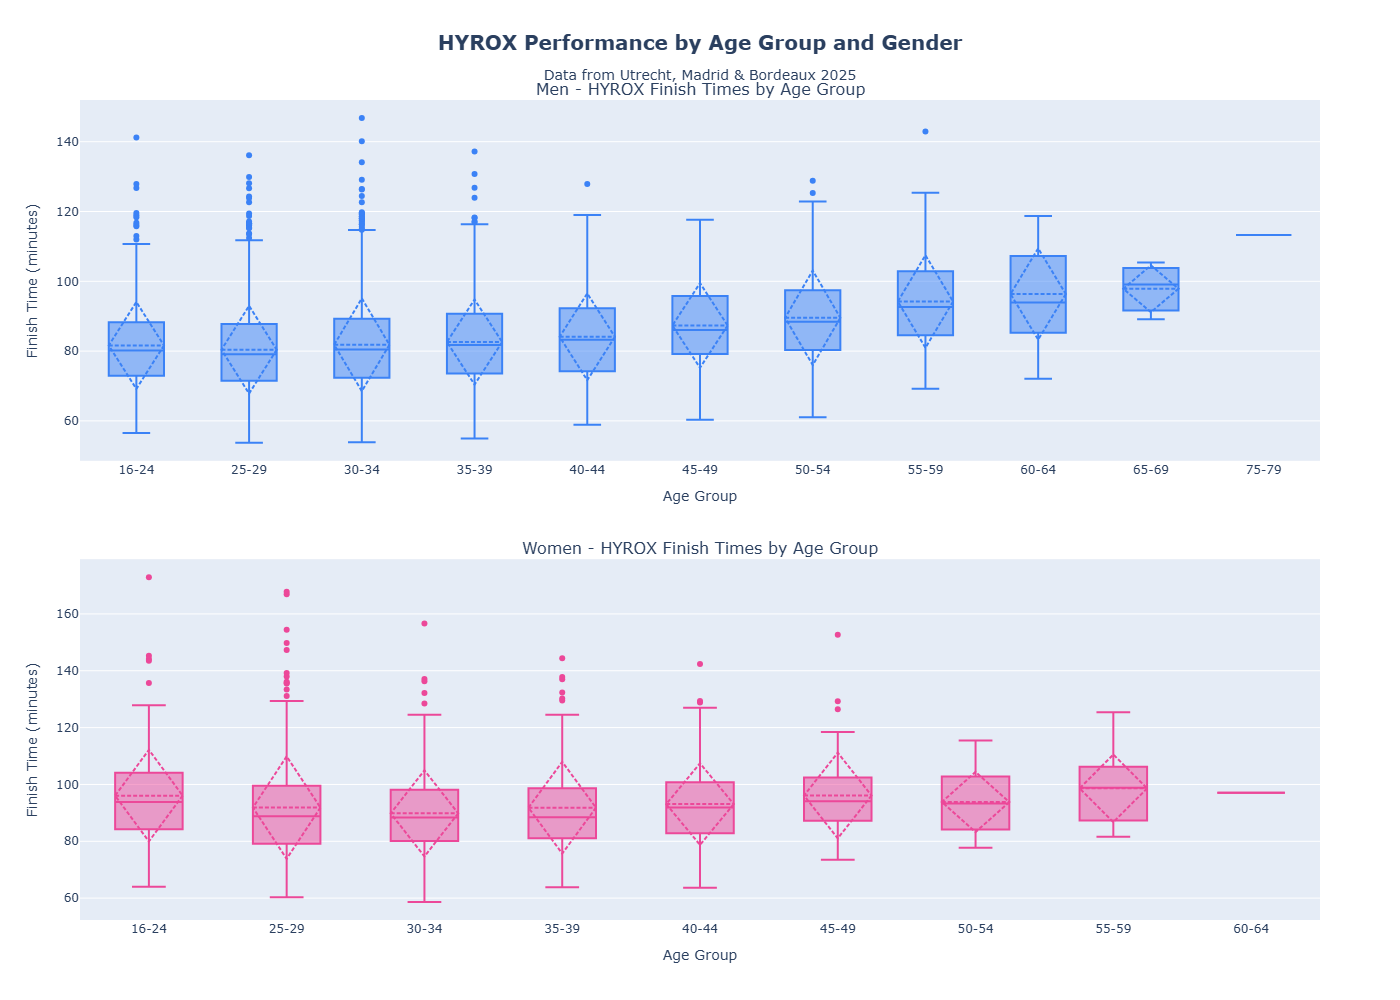
Men's Performance by Age
| Age Group | Average Time | Median Time | Sample Size |
|---|---|---|---|
| 16-24 | 1:21:37 | 1:20:12 | 503 athletes |
| 25-29 | 1:20:23 | 1:19:06 | 963 athletes |
| 30-34 | 1:21:48 | 1:20:29 | 1,019 athletes |
| 35-39 | 1:22:36 | 1:21:46 | 819 athletes |
| 40-44 | 1:24:05 | 1:23:16 | 475 athletes |
| 45-49 | 1:27:20 | 1:26:01 | 265 athletes |
| 50-54 | 1:29:32 | 1:28:24 | 149 athletes |
| 55-59 | 1:34:12 | 1:32:40 | 81 athletes |
| 60-64 | 1:36:21 | 1:33:54 | 28 athletes |
| 65-69 | 1:37:52 | 1:39:07 | 3 athletes |
| 75-79 | 1:53:17 | 1:53:17 | 1 athlete |
Key insight: The 25-29 age group posts the fastest average time (1:20:23), narrowly edging out the youngest competitors. This suggests peak HYROX performance occurs in the mid-to-late twenties, when athletic ability, training experience, and life circumstances align optimally.
Women's Performance by Age
| Age Group | Average Time | Median Time | Sample Size |
|---|---|---|---|
| 16-24 | 1:36:04 | 1:33:48 | 164 athletes |
| 25-29 | 1:31:51 | 1:28:48 | 255 athletes |
| 30-34 | 1:29:49 | 1:28:20 | 198 athletes |
| 35-39 | 1:31:49 | 1:28:25 | 141 athletes |
| 40-44 | 1:33:05 | 1:31:53 | 99 athletes |
| 45-49 | 1:36:06 | 1:34:03 | 52 athletes |
| 50-54 | 1:33:49 | 1:33:18 | 20 athletes |
| 55-59 | 1:38:37 | 1:38:48 | 12 athletes |
| 60-64 | 1:37:06 | 1:37:06 | 1 athlete |
Key insight: Women peak slightly later than men, with the 30-34 age group posting the fastest average time (1:29:49). The 25-29 group is also extremely competitive, suggesting female HYROX athletes hit their stride in their late twenties to early thirties.
The Performance Decline Curve: Not as Bad as You Think

When we plot average finish times across age groups, a clear pattern emerges:
Men's Decline Rate
From peak performance (25-29) to each subsequent age bracket:
- 30-34: 1.5% slower (84 seconds)
- 35-39: 2.7% slower (2 minutes 10 seconds)
- 40-44: 4.6% slower (3 minutes 42 seconds)
- 45-49: 8.3% slower (6 minutes 57 seconds)
- 50-54: 11.4% slower (9 minutes 9 seconds)
- 55-59: 17.2% slower (13 minutes 49 seconds)
Translation: If you're 40-44 and targeting a competitive time, expect to be roughly 4-5% slower than your 25-29-year-old self at peak fitness. That's only 3-4 minutes on a 1:20 finish—entirely manageable with smart training.
The steeper decline doesn't kick in until after 50, where metabolic changes, muscle mass loss, and reduced VO₂ max become more pronounced.
Women's Decline Rate
Women show a slightly different pattern:
- Peak age: 30-34 (1:29:49 average)
- 40-44: 3.6% slower (3 minutes 16 seconds)
- 45-49: 7.0% slower (6 minutes 17 seconds)
- 50-54: 4.4% slower (4 minutes)
- 55-59: 9.8% slower (8 minutes 48 seconds)
Notable pattern: The 50-54 women's group actually posts faster times than 45-49. This likely reflects selection bias—older women who continue competing at HYROX are exceptionally fit and motivated, not representative of the general population.
The Shocking Truth About Variability
Here's where it gets interesting: the spread within each age group is massive.
Look at the 30-34 male age group:
- Top 25% (fastest quarter): 1:12:20 or faster
- Median athlete: 1:20:29
- Average athlete: 1:21:48
- Bottom 25% (slowest quarter): 1:29:17 or slower
That's a 17-minute gap between the top 25% and bottom 25% within a single age bracket. The variability within age groups is massive—a well-trained 30-34-year-old beats an untrained peer by more time than the average difference between 25-29 and 45-49 age groups.
What this means: Your training, experience, and race-day execution matter far more than your age. A well-trained 45-year-old will destroy an untrained 25-year-old every single time.
Where the Age Gap Shows Up Most
When we dig into the detailed stats, three patterns emerge:
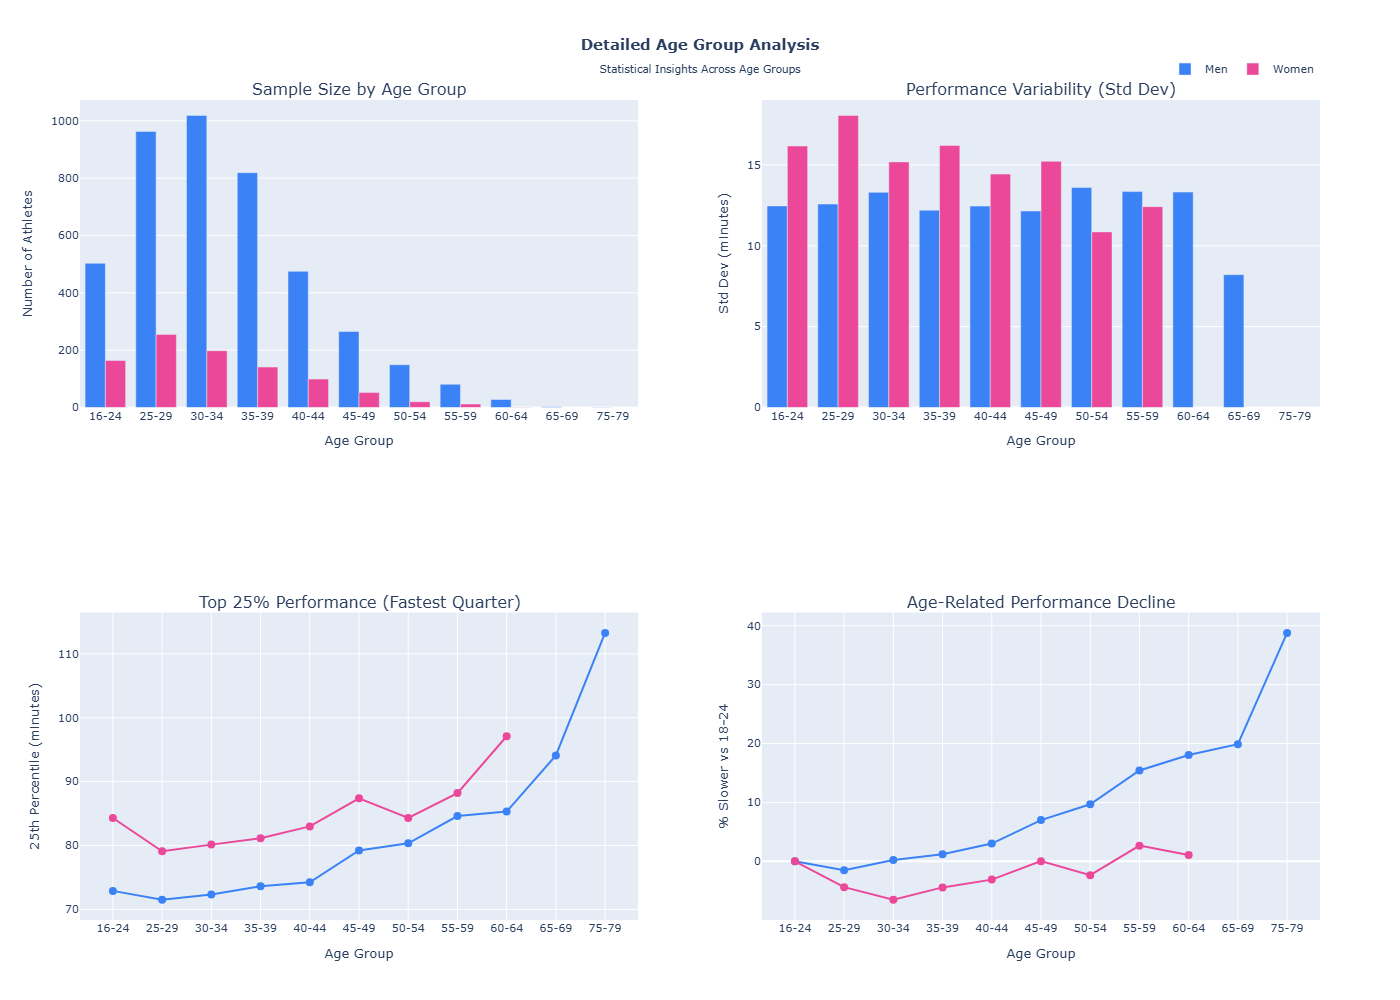
1. Elite Athletes Age Gracefully
Look at the top 25% performance (fastest quarter of finishers) in each age group:
- 25-29 men: 1:11:32 or faster
- 30-34 men: 1:12:20 or faster
- 35-39 men: 1:13:37 or faster
- 45-49 men: 1:19:13 or faster
- 55-59 men: 1:24:37 or faster
The top-tier athletes maintain remarkably similar performances across age groups through their 30s. The fastest quarter of 35-39 athletes are only about 2 minutes slower than the fastest quarter of 25-29 athletes. Why? Because elite athletes understand pacing, have refined technique over years, and train smarter instead of harder.
2. Performance Variability Stays Consistent
Standard deviation (spread of results) remains relatively constant across age groups:
- 25-29 men: plus/minus 12.6 minutes
- 35-39 men: plus/minus 12.2 minutes
- 45-49 men: plus/minus 12.2 minutes
- 55-59 men: plus/minus 13.3 minutes
Insight: Older age groups aren't more variable—they're just slower on average. The competitive depth is similar whether you're 30 or 50.
3. Sample Size Matters (A Lot)
Notice how sample sizes drop dramatically after age 50:
- 30-34 men: 1,019 athletes
- 50-54 men: 149 athletes
- 60-64 men: 28 athletes
- 75-79 men: 1 athlete
This isn't just fewer people racing—it's selection bias in action. The athletes still competing at 55+ are disproportionately fit, experienced, and genetically gifted. Their times don't reflect "average" aging—they reflect aging in the fittest 1% of the population.
Gender Performance Gaps Across Age
The male-female performance gap is well-documented in endurance sports, and HYROX confirms the pattern:
| Age Group | Men's Average | Women's Average | Gap |
|---|---|---|---|
| 16-24 | 1:21:37 | 1:36:04 | 14:27 (17.7%) |
| 25-29 | 1:20:23 | 1:31:51 | 11:28 (14.2%) |
| 30-34 | 1:21:47 | 1:29:49 | 8:02 (9.8%) |
| 35-39 | 1:22:33 | 1:31:49 | 9:16 (11.2%) |
| 40-44 | 1:24:05 | 1:33:05 | 9:00 (10.7%) |
| 45-49 | 1:27:20 | 1:36:06 | 8:46 (10.0%) |
Fascinating trend: The gender gap narrows significantly in the 30-34 age group (9.8%) compared to 16-24 (17.7%). This suggests:
- Women's HYROX-specific training may take longer to optimize
- Younger men benefit more from raw power/speed, which fades faster than endurance
- Technique and pacing (where women often excel) matter more as both genders age
Practical Takeaways for Your Training
If You're in Your 20s
Advantages: Peak power, recovery, and VO₂ max
Focus areas:
- Build movement efficiency now—it pays dividends for decades
- Experiment with high-intensity training while recovery is fast
- Establish baseline strength and technique
Target: Sub-1:20 (men) or sub-1:30 (women) is achievable with 6+ months of focused training
If You're 30-39
Advantages: Experience, pacing discipline, training consistency
Focus areas:
- Prioritize recovery—you can't bounce back like a 22-year-old
- Dial in race-day execution and pacing
- Maintain power through targeted strength work
Target: Sub-1:25 (men) or sub-1:35 (women) is competitive for your age
If You're 40-49
Advantages: Mental toughness, strategic racing, life experience Focus areas:
- Injury prevention is non-negotiable—strength training 2-3x/week
- Technique becomes more important than volume
- Smart pacing beats adrenaline every time
- Invest in proper recovery tools — your body needs more help bouncing back between sessions
Target: Sub-1:30 (men) or sub-1:40 (women) puts you in the top half of your age group
If You're 50+
Advantages: You're already beating 95% of your peers by showing up
Focus areas:
- Consistency beats intensity—show up 4-5 days/week
- Mobility and injury prevention are your top priorities
- Race execution matters more than training volume
Target: Finishing healthy and strong is a win. Sub-1:40 (men) or sub-1:50 (women) is excellent.
The Most Important Finding
Age matters, but not as much as you think.
The performance decline from 25 to 45 is only 6-8 minutes for most athletes—less than the time gained from proper race-day pacing, warm-up, and station efficiency.
Your biggest enemy isn't aging—it's inconsistent training, poor recovery, and bad race-day decisions.
The athletes who age best:
- Train consistently (not heroically)
- Prioritize injury prevention over PRs
- Race with discipline, not adrenaline
- Adapt their training as their body changes
You can't stop aging. But you can absolutely beat the average decline curve with smart, consistent training.
What's Next?
Use this data to:
- Set realistic goals for your age group
- Stop comparing yourself to 25-year-old elites
- Focus on controllables: pacing, technique, consistency
- Compete within your age bracket for more meaningful benchmarks
Your action plan:
- Find your age group median time (table above)
- Use our Pacing Calculator to predict your finish time
- Set a goal 5-10% faster than median (achievable with 3-6 months training)
- Focus on station efficiency and pacing (see our pacing strategy article)
- Track progress against age peers, not overall leaderboard
Age is just a number. Training, execution, and consistency are what separate the top 10% from the rest—at any age.
Want a structured plan? Our 12-Week Training Program ($29.99) addresses the key areas where Masters athletes lose time — running under fatigue, station transitions, and pacing discipline. If running is your biggest limiter (and the data says it probably is), the 10-Week Running Program ($19.99) targets exactly that.
Related Articles:
- Station Performance Analysis — Where to focus training
- What is a Good HYROX Time? — Benchmark your performance
- The Hidden 3 Minutes — Optimize transitions
- First HYROX Race Guide — Complete preparation
- HYROX Gear Recommendations — Shoes, watches, and recovery tools we recommend
Data source: 5,248 race results from HYROX Utrecht, Madrid, and Bordeaux 2025.