Every HYROX athlete experiences it: that moment mid-race when your legs feel heavy, your pace drops, and maintaining your opening speed seems impossible. But when exactly does this "breaking point" occur? And more importantly, what separates athletes who manage degradation from those who collapse?
We analyzed running split data from 700,000+ race results to map exactly when and how pace degradation occurs - and the patterns are remarkably consistent.
The Degradation Curve: A Universal Pattern
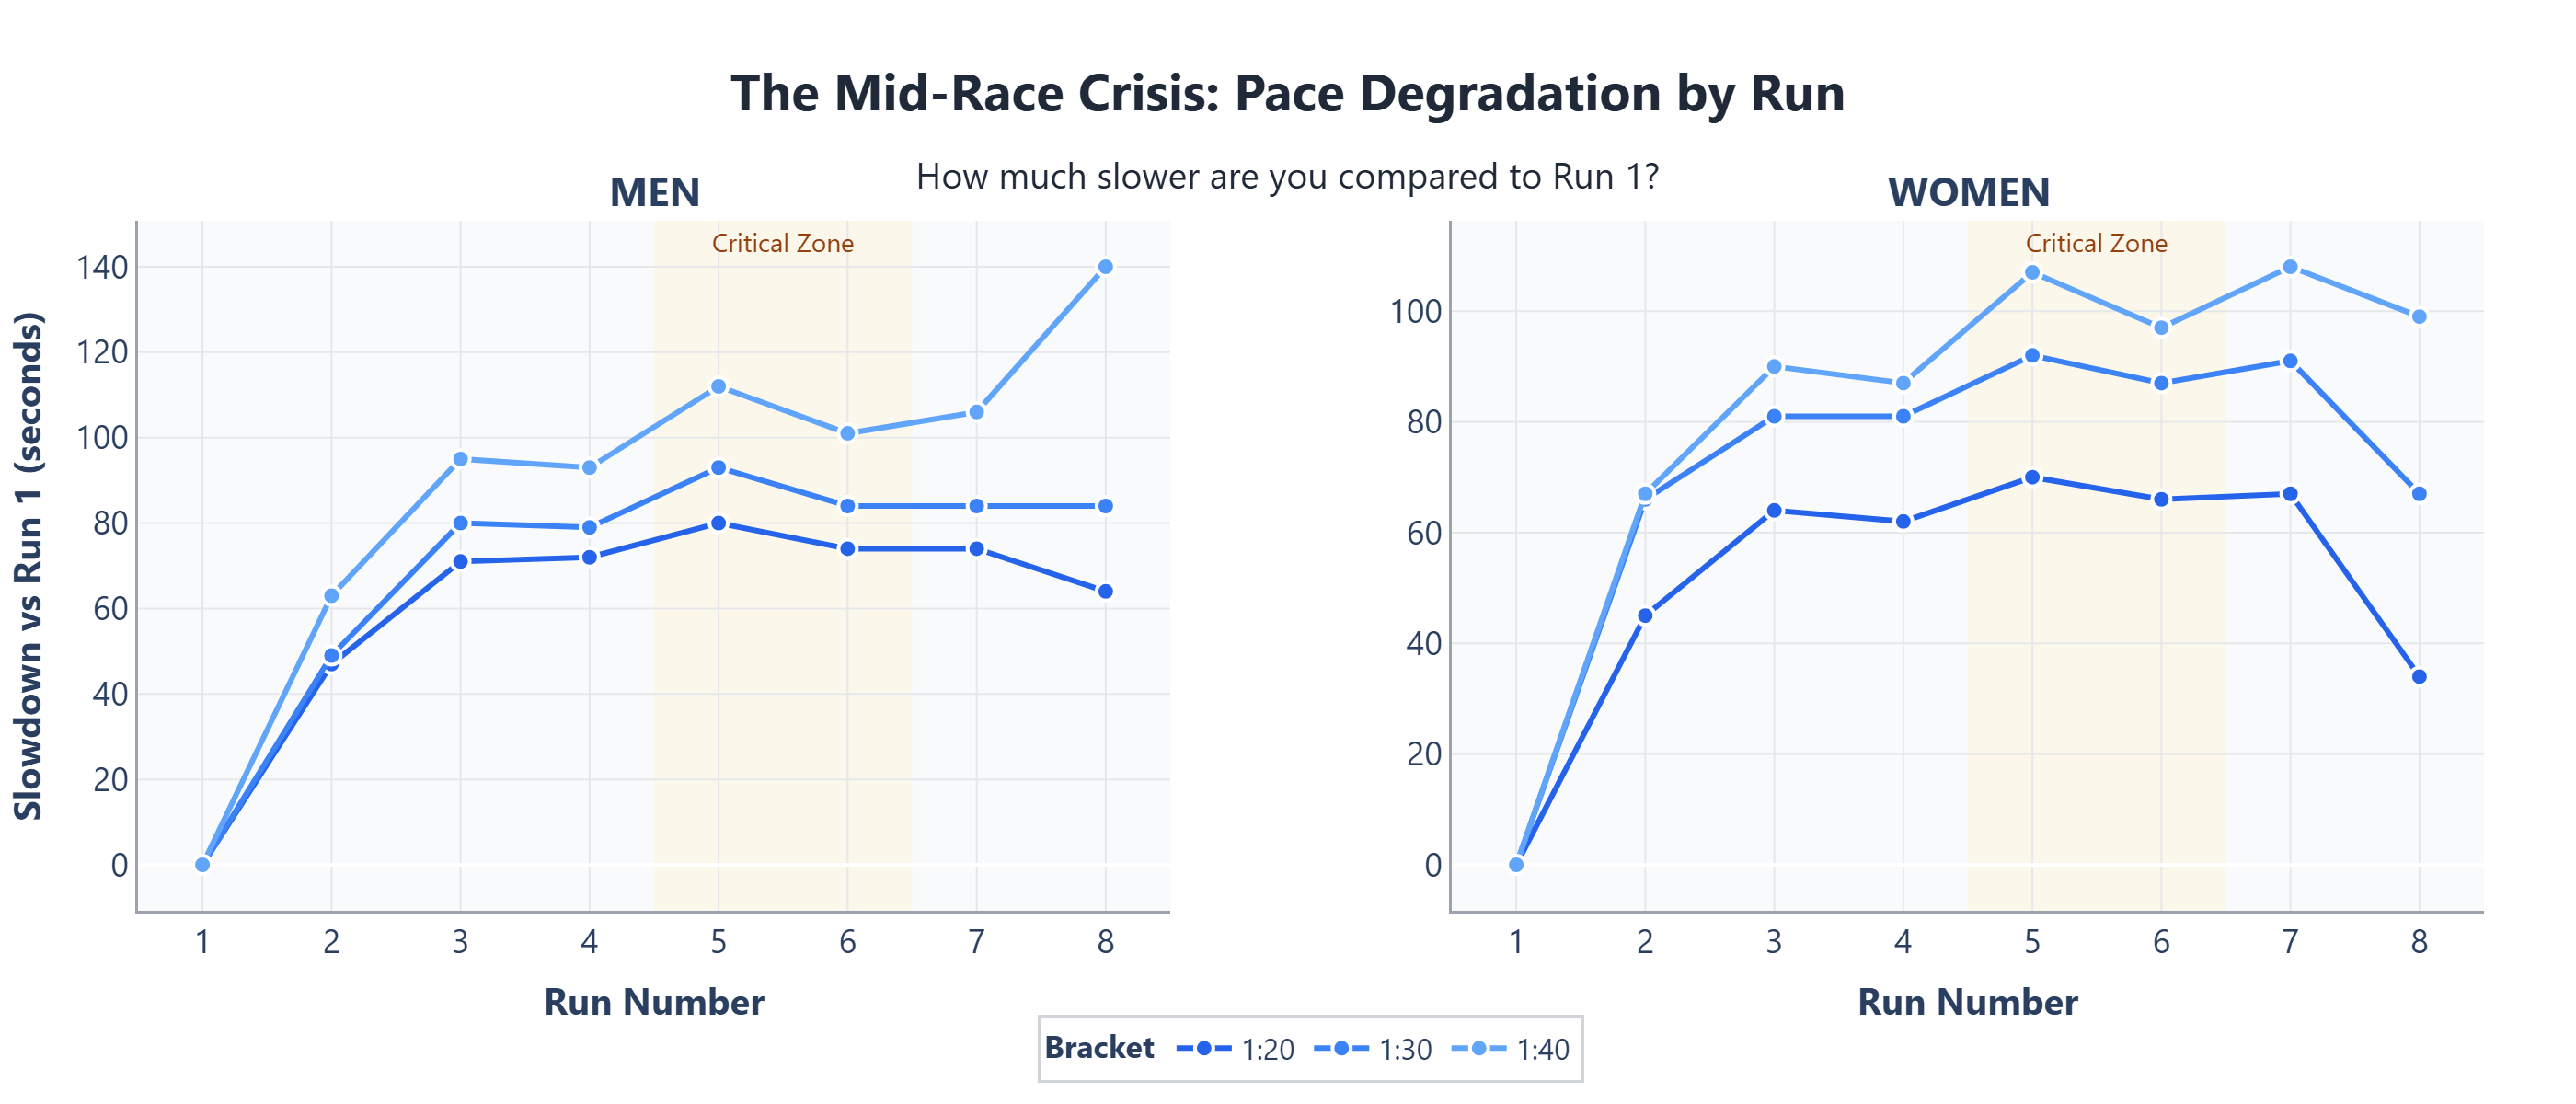
The chart above shows pace degradation across all 8 running segments, measured as seconds slower than Run 1. Every bracket shows the same pattern: progressive slowdown that accelerates mid-race.
But the magnitude varies dramatically. Advanced athletes (1:20 bracket) slow by ~60 seconds from Run 1 to Run 8, while recreational athletes (1:40) slow by ~140 seconds - more than twice as much.
The Critical Zone: Runs 5-6
The data reveals a clear "breaking point" around Runs 5-6, highlighted in yellow on the chart. This is where pace degradation accelerates most dramatically for all brackets.
Why Runs 5-6?
By this point in the race, athletes have completed:
- 4km of running
- SkiErg (1000m)
- Sled Push (50m)
- Sled Pull (50m)
- Burpee Broad Jumps (80m)
- Row (1000m)
The cumulative fatigue from these efforts - particularly the leg-intensive sled work and metabolically demanding Row - creates a physiological crisis point. Your glycogen stores are depleted, lactate accumulation increases, and mechanical efficiency deteriorates.
The Numbers
Men - Average degradation by run:
| Run | 1:20 Bracket | 1:30 Bracket | 1:40 Bracket |
|---|---|---|---|
| 1 | Baseline (0s) | Baseline (0s) | Baseline (0s) |
| 2 | +47s | +49s | +1:03 |
| 3 | +1:11 | +1:20 | +1:35 |
| 4 | +1:12 | +1:19 | +1:33 |
| 5 | +1:20 | +1:33 | +1:52 |
| 6 | +1:14 | +1:24 | +1:41 |
| 7 | +1:14 | +1:24 | +1:46 |
| 8 | +1:04 | +1:24 | +2:20 |
Notice the jump from Run 4 to Run 5 across all brackets - this is the crisis point.
Women show similar patterns with slightly better management:
Women maintain pace more consistently in the early-to-mid race but still experience the Run 5-6 degradation spike. Their smaller absolute slowdown (compared to men) suggests better pacing strategies or superior fatigue resistance.
What Advanced Athletes Do Differently
Advanced athletes don't avoid pace degradation - they manage it better. Here's what separates the 1:20 bracket from slower finishers:
1. Conservative Start
Advanced athletes run Run 1 only ~20 seconds faster than their average pace across all 8 runs. Recreational athletes, by contrast, start 40+ seconds faster than their average.
The math:
- Advanced: Run 1 at 4:19, average 5:19/run (20s under average)
- Recreational: Run 1 at 4:53, average 6:22/run (89s under average)
Starting conservatively preserves glycogen and delays the breaking point.
2. Aerobic Base
Pace degradation is fundamentally an aerobic fitness issue. Athletes with larger aerobic engines:
- Clear lactate more efficiently
- Utilize fat as fuel longer
- Maintain running economy under fatigue
- Recover faster in RoxZone
This is why the 60-second vs 140-second difference isn't random - it reflects underlying aerobic capacity differences.
3. Mental Resilience
The mid-race crisis is as psychological as physical. Advanced athletes expect degradation and accept it, maintaining effort even as pace slows. Recreational athletes often "give up" when they realize they can't sustain opening pace, leading to cascading slowdown.
The Station Impact
Interestingly, the degradation pattern isn't linear. Notice how:
- Run 2 (+47-49s) comes after SkiErg (relatively light)
- Run 3 (+1:11-1:20) comes after Sled Push (heavy leg work)
- Run 5 (+1:20-1:33) comes after Row (metabolically demanding)
- Run 8 (variable) comes after Sandbag Lunges (mental + physical exhaustion)
The type and intensity of the preceding station directly influences the next run's degradation. Heavy leg work (sleds and lunges) causes mechanical fatigue, while metabolic stations (Ski, Row) deplete energy systems.
Training Implications
Understanding when and why you slow down informs how you should train:
Build Aerobic Base
The foundation for degradation management is aerobic capacity. Athletes with strong aerobic bases show less degradation because they:
- Operate at lower percentages of VO2 max at race pace
- Recover faster between stations
- Utilize fat oxidation longer
Recommendation: 60-70% of your training should be low-intensity aerobic work (Zone 2, easy pace). This isn't sexy, but it's what prevents the breaking point from becoming a collapse.
Practice Race-Pace Running When Fatigued
The specificity principle matters. Running fresh in training doesn't prepare you for Runs 5-8 in the race.
Effective workout:
- Warm up 10-15 minutes
- 5 x [1km at race pace + 50 burpees + 2 min rest]
- Cool down
This simulates running when metabolically fatigued - exactly the race demand.
Pace Strategy
Based on the data, optimal pacing looks like:
- Run 1-2: Slightly conservative (5-10s slower than average target)
- Run 3-4: Target pace
- Run 5-6: Accept 10-15s degradation, maintain effort
- Run 7-8: Mental push, accept further degradation
Fighting the degradation by "pushing harder" in Runs 5-6 often leads to catastrophic collapse in Runs 7-8 (note the 2:20 degradation for 1:40 men in Run 8 - this is from overcooking earlier).
The Finishing Phenomenon
Some athletes show a "second wind" effect - note how Run 6-7 degradation plateaus or even improves slightly. This represents athletes who:
- Properly paced early runs
- Have sufficient aerobic reserve
- Experience psychological lift from being "almost done"
However, the Run 8 variance is high because some athletes dig deep for a finishing kick, while others completely empty the tank.
Key Takeaway
The mid-race crisis (Runs 5-6) is inevitable but manageable. Advanced athletes slow by 60-80 seconds from baseline, recreational athletes by 120-150 seconds. The difference isn't avoiding degradation - it's minimizing it through proper pacing, aerobic base, and mental preparation.
Practical Application
If you're fading hard in Runs 5-8:
- Your aerobic base needs work (increase Zone 2 training volume)
- You're starting too fast (run Run 1 more conservatively)
- You're not training race-specific fatigue (add workouts that simulate running when tired)
If you maintain pace well:
- You might be able to start slightly faster (test in training)
- Your aerobic base is solid (maintain it)
- Consider if you're leaving time on the table by being too conservative
Track your own degradation: Record your split times and calculate degradation relative to Run 1. If your pattern deviates significantly from the brackets above, you have specific pacing issues to address.
The Mental Game
Knowing that everyone slows down is liberating. When Run 5 feels hard and your pace drops, you're not failing - you're experiencing exactly what the data predicts. Advanced athletes maintain mental composure during this crisis, accepting the slower pace while maintaining effort.
The athlete who panics at the breaking point and "gives up" loses minutes. The athlete who says "this is normal, stay composed" loses seconds.
Want to fight the fade? Our 10-Week Running Program ($19.99) trains you to maintain pace under fatigue with zone-based sessions and run-station-run combos. For the complete package, see our 12-Week Training Program ($29.99).
Related Articles:
- Station Performance Analysis — Where to focus training
- The Hidden 3 Minutes — Optimize transitions
- HYROX Running Strategy — Run smart, not just fast
- Pacing Calculator Guide — Plan your splits
- The Perfect HYROX Warm-Up — Cut 3-8 min off your time